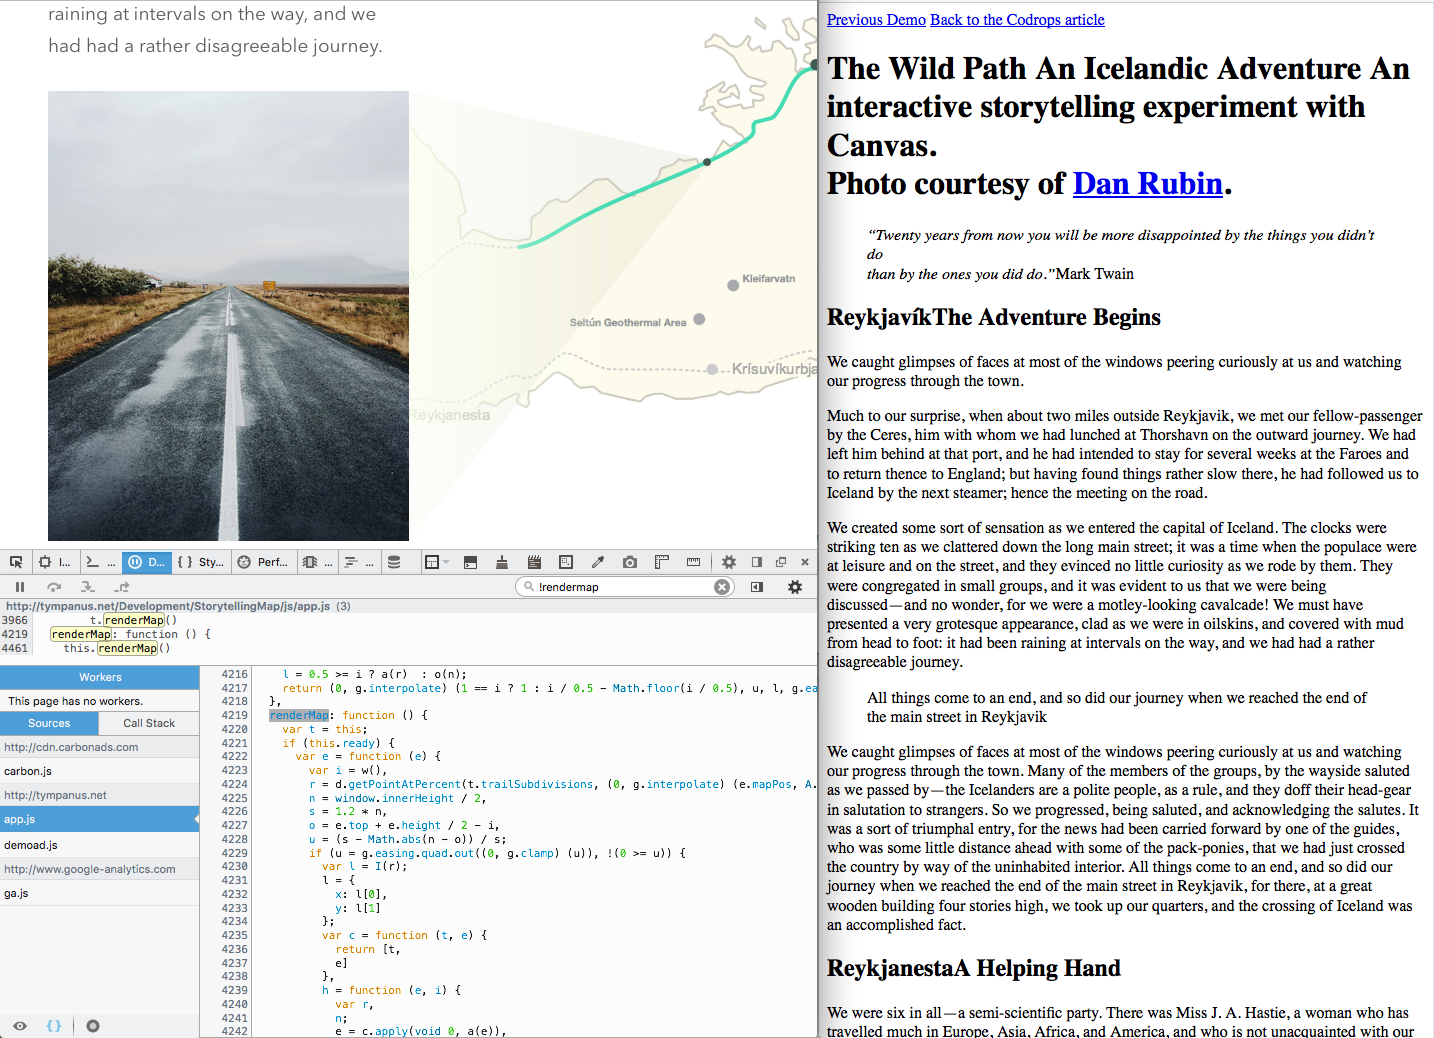
"The Wild Path. An Icelandic Adventure. An interactive storytelling experiment with Canvas." is a beautiful demo. We need more demos like this one.
The map trace is synchronized with the text on the screen. The map is defined as SVG but controlled by canvas.
<div class="container">
    <canvas style="position: absolute; top: 0px; left: 0px;" height="549" width="817"></canvas>
</div>
with:
    this.canvas = (0, h.default) (e, i), this.canvas.style.position = 'absolute', this.canvas.style.top = 0, this.canvas.style.left = 0, this.ctx = this.canvas.getContext('2d', {
      alpha: !1
    }), this.ctx.fillStyle = '#fff', this.ctx.fillRect(0, 0, this.state.width, this.state.height), this.container.appendChild(this.canvas), this.calculateSections(), Array.from(this.props.textContainer.querySelectorAll('img')).forEach(function (e) {
      e.addEventListener('load', function (e) {
        t.calculateSections(),
        t.renderMap()
      })
    })
Images have a load event, triggering these functions.
function(e) {
  t.calculateSections(), t.renderMap()
}
Some sections have an associated zoom given through a data- attribute, aka private to the page. Perfect usage of data-.
<section class="js-section" data-zoom-middle="2">
and also a data-pos
<figure>
    <img class="js-image" data-pos="0.25" src="img/journey/9.jpg">
    <figcaption>All things come to an end, and so did our journey when we reached the end of the main street in Reykjavik</figcaption>
</figure>

[…]

<figure>
    <img class="js-image" data-pos="0.6" src="img/journey/5.jpg">
    <figcaption>I was the geographer, whose mission it was to make a map of a small portion of the country traversed.</figcaption>
</figure>
All of that is simple. The code is a nice read.
But the best part of it comes from just reading without CSS and JS. We still get a readable text. And it's rare enough these days, that it has to be praised on the tone, yes it's possible.

One nitpick: The lack of spaces in between some words.
Otsukare!